
Infographics = Data brought to life...
Data analysis was once the tedious job of manually entering and combing through months of data for trends...
...today smart software, analysis tools and an influx of user friendly infographic tools, are making data not only usable but also relevant to whole new audiences.
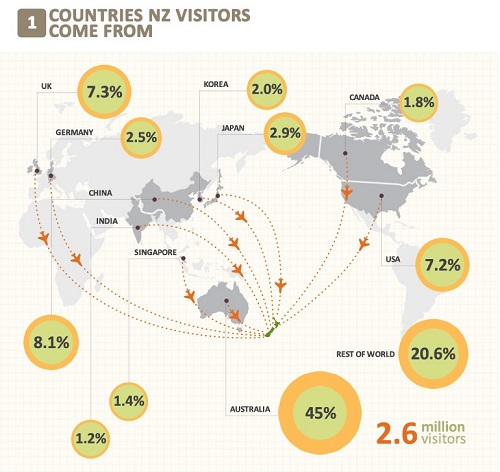
Below is a link to some 2012-13 Tourism NZ stats recently released as a user friendly infographic.
2012-2013 New Zealand Visitor Highlights (including spend, countries, bed nights...)
Need help bringing your data to life?
If you would like to increase the impact and relevance of your information for press releases, presentations or marketing, please get in touch with our team.
Posted: Wed 08 Oct 2014